
SBN Graph
SBN Graph
SBN Graph
Module: Utilities
Overview
Use the SBN Graph program to visually display usage statistics from SBN. The SBN Graph program provides several types of charts and the ability to define the parameters of each chart to get the data you need into a graph format. SBN Graph exists outside the SBN program, and must be installed separately.
In order for the SBN Graph program to retrieve data from the server, you must have Sybase client installed to establish a server address for the SBN Graph program. This document covers the installation, setup and use of the SBN Graph program.
Installing SBN Graph
Use the following steps to install SBN Graph on a Windows-based computer:
1. Unzip the installation files.
2. Open the SBN Graph folder that you unzipped.
3. Double-click the Setup.exe file.
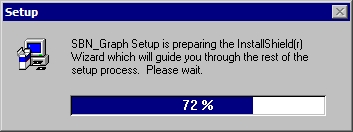
‰ The Install Shield Wizard begins.
‰ The SBN Graph Installation Welcome window appears.
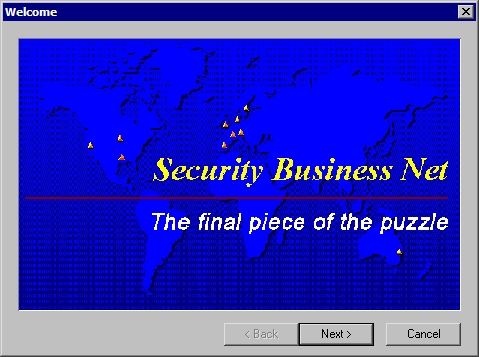
4. Choose Next.
‰ The Setup Welcome window appears.
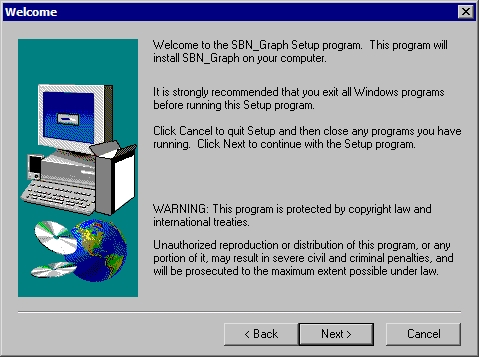
5. Choose Next.
‰ The User Information window appears.
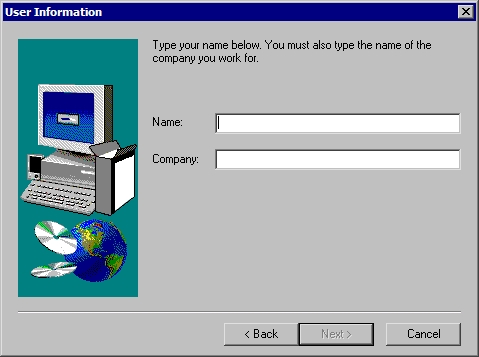
6. Type the User Name and Company Name, and choose Next.
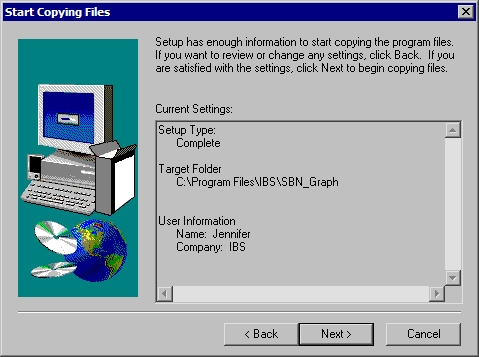
The Setup settings window appears.
7. Choose Next.
‰ The program copies the files to the hard drive and the Complete dialog box opens.
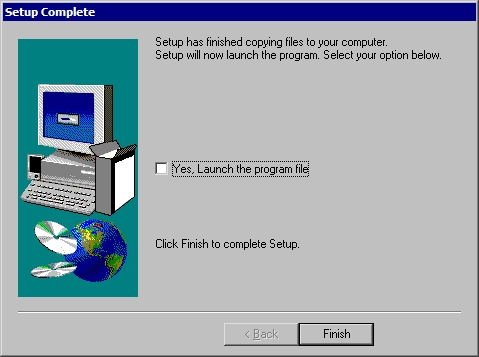
8. Choose Finish.
Setting Up the Sybase Server
Use the following steps to set up the Sybase server:
1. In Windows, choose Start.
2. Go to Programs > Sybase > DSEDIT.
‰ The DSEDIT program starts, and the Select Directory Service window appears.
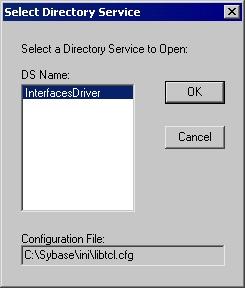
3. Choose OK.
‰ The Interfaces Driver window opens with a list of servers.
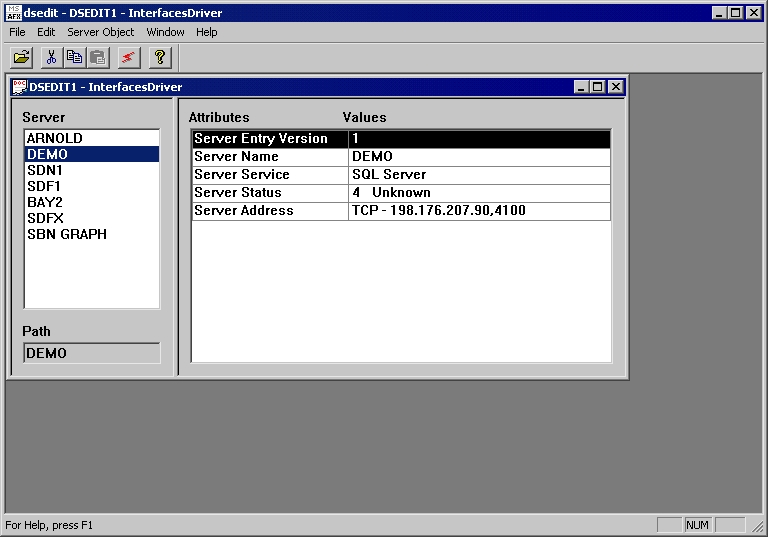
4. In the Server Object Menu, select Add.
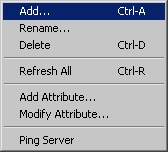
‰ The Input Server Name window appears.
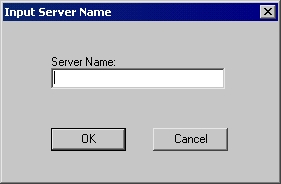
5. Type the name of the server.
6. Choose OK.
‰ The main DSEDIT window reappears with the new server listed.
7. To define the server address, select the Server line.
8. Right-click on the Server Address line.
9. Select Modify Attributes.
‰ The Network Address Attribute window appears.
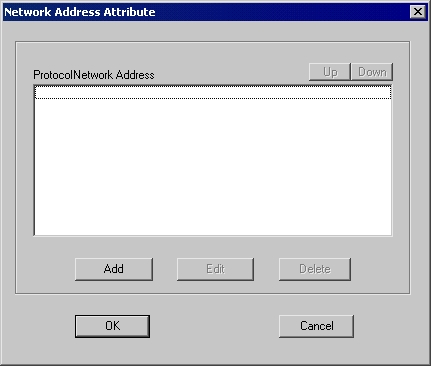
10. Choose Add.
‰ The Input Network Address for Protocol window appears.
11. Leave the Protocol as TCP, and type
the IP address and the socket number for the server you wish to use. You
should type it as IP address, socket #.
(ie. 111.222.333.44, 9999)
12. Choose OK.
‰ The new server address is listed in the Network Address Attribute window.
13. Choose OK.
‰ The new server and address appear in the list.
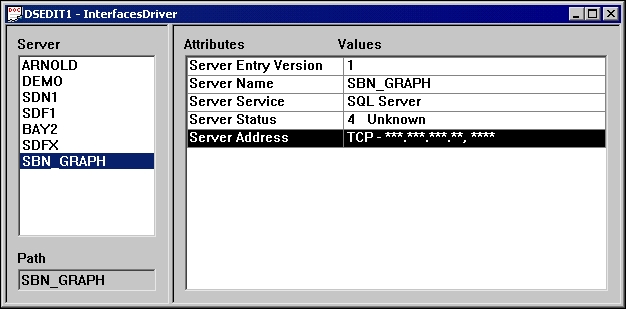
14. Close the DSEDIT program.
‰ You have now completed the installation process and can launch the SBN Graph application.
Working with SBN Graph
The following sections describe how to use the SBN Graph program. When you first open the SBN Graph program, the SBN System Graph window appears. In the SBN System Graph window, you open new or existing graphs. You can monitor many different types of information with several different graphic representations. You can also manipulate the look and function of each graph.
Using the SBN System Graph Window
The SBN System Graph window appears each time you open the SBN Graph program. You can close the SBN System Graph and reopen it by right-clicking in any area of the graph and selecting SBN System Graph.
Use Cycle to cycle through all graphs. As the delay expires for a graph, it becomes visible until another delay expires for another graph, and then it is displayed. You can automatically view several graphs as they update.
Note: Graphs with the menu bar displayed do not cycle.
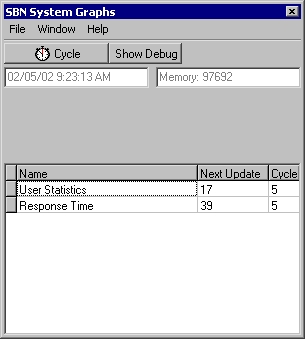
The following graphic shows the SBN System Graph window with information displayed.
Field/Column Descriptions — System Graph
The following table describes the fields and columns used in the SBN System Graph window.
Field/Column |
Description |
Current Time and Date (No label) |
Displays the current system date and time. |
Memory
Usage |
Displays the total memory usage for the program. |
Name |
Title of graph/chart. |
Next Update |
Displays the time in seconds until the next data refresh. |
Cycle |
Delay in seconds between cycles for the graph. |
Creating a New Graph
Use the following steps to create a new graph:
1. In the SBN System Graph window, choose File>New Window or Window>New Window.
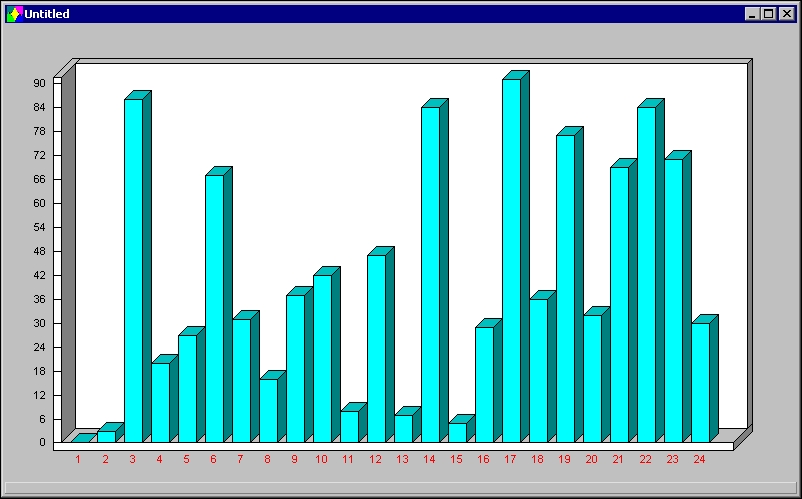
‰ A new graph window opens with sample data displayed.
Customizing a New Graph
The SBN Graph program offers many features for customizing graphs so that they look and function exactly how you wish to display your information. The menu bar in SBN Graphs offers the key functionality for customization.
Use the following steps to customize graphs:
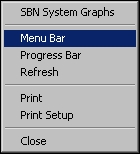
1. To view the Menu Bar, right click inside the graph window and select Menu Bar.
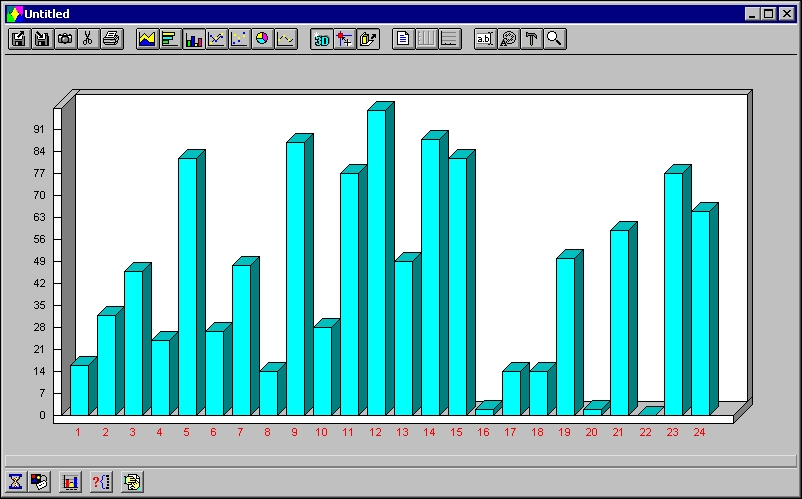
‰ The Graph window now displays menu buttons at the top and bottom of the window.
2. To edit key graph information, choose Edit Properties.
The Graph Definition window appears.
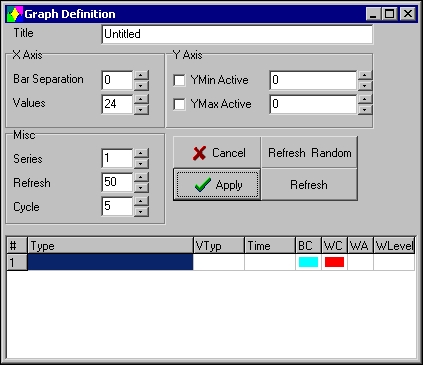
3. Enter the following information, as needed:
l In Title — type the name you wish to display at the top of the graph window.
l In Bar Separation — select the distance between bars.
Note: A value of zero may cause improper scaling.
l In Values — select the number of bars or points to display on the graph.
l In YMin Active — select the least displayable value for the graph.
l In YMax Active — select the highest displayable value for the graph.
Note: If a YMin or YMax remains unassigned, the program automatically adjusts the value for proper scalability.
l In Series — select the number of active fields for the graph.
l In Refresh — select the number of seconds between chart updates.
l In Cycle — select the delay in seconds between chart cycles.
l In Type — select the type of graph you wish to use. See Char Types for more information.
l In Vtyp — select the type of data to include in the graph. Selection available
q Min
q Max
q Avg
q Sum
q Sample
l In Time — select the duration of time you want to include in the graph. Selections range from one minute to one week.
l In BC — select the bar color to use for the series.
l In WC — select the color to use when the warning level of the series is reached.
l In WA — select the box to activate the warning system.
Note: When you select the WA box, a new field in which you enter the Wlevel appears just below Refresh.
l In Wlevel — select the level for when you want the bars to turn to the chosen WC.
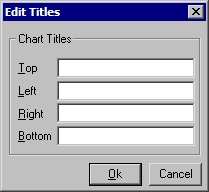
4. Choose Edit Titles from the upper menu bar to add titles to the graph and axis.
‰ The Edit Titles window appears.
5. Choose Change Fonts from the upper menu bar.
‰ The Change Fonts menu appears.
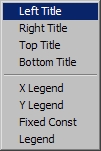
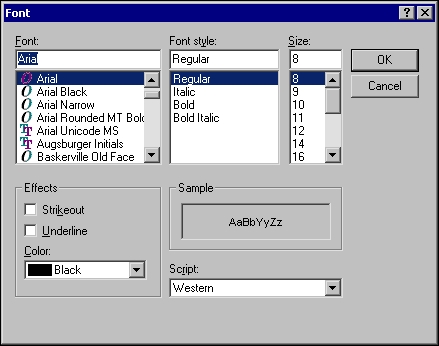
6. Select the title for which you want to change fonts.
‰ The font window appears.
7. Choose Chart Tools to add patterns, a legend, or additional colors to the graph.
‰ The Chart Tools menu appears.
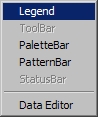
8. Select the following, as needed:
l Legend — displays a legend box on the right side.
l PalletteBar — displays additional colors at the top of the graph.
l PatternBar — displays patterns at the top of the graph.
l Data Editor — displays values used in graph.
9. Select Vertical and Horizontal grid lines, if needed.
Saving a Graph
You must save graph options in order to reproduce the same graphs from the system.
Use the following steps to save a graph:
1. In SBN Graphs, at the SBN System Graph window, choose File>Save As...
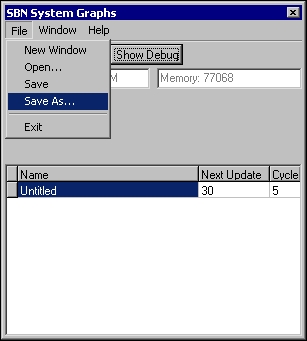
‰ The Windows Save window opens.
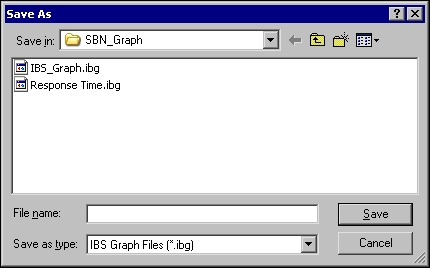
2. Type the file name.
3. Choose Save.
Graph Types
The following table describes the chart types available in the Graph Definition window menu.
Chart Type |
Description |
Alarm Queue 1-16 |
Displays the number of alarms contained in each individual queue. |
All Alarm Queues |
Displays the total number of alarms for all queues. |
Immediate Queues 1-5 |
Displays the number of signals in each immediate queues. |
All Immediate Queues |
Displays the total number of signals for all immediate queues. |
Test Queue |
Displays the number of installations in the test queue. |
Response Time Level 1 |
Displays the time between alarm and acknowledge for signals with a priority less than or equal to the number defined in option graphl1. O Response time includes alarms not yet acknowledged, which increases actual response time until the alarm is acknowledged. |
Response Time Level 2 |
Displays the time between alarm and acknowledge for signals with a priority less than or equal to the number defined in option grahl1, but less than the number defined in option graphl2. |
Response Time Level 3 |
Displays the time between alarm and acknowledge for signals with a priority less than or equal to the number defined in option graphl2. |
Number of Alarms Received |
Displays the number of alarm received. |
Number of Alarms Generated |
Displays the number of alarms sent to alarm queues 1-16. The difference between the number of alarms received and the number of alarms generated indicates alarms handled by the system. |
Monitoring Users |
Displays the number of operators logged into the monitoring module of the system. |
Service Users |
Displays the number of operators logged into the service module of the system. |
Billing Users |
Displays the number of operators logged into the billing module of the system. |
Marketing Users |
Displays the number of operators logged into the marketing module of the system. |
Total Users |
Displays the number of users logged into SBN. |
Number of Accounts |
Displays the number of installations entered. |
Number of Inquiries |
Displays the number of marketing leads entered. |
Graph Views
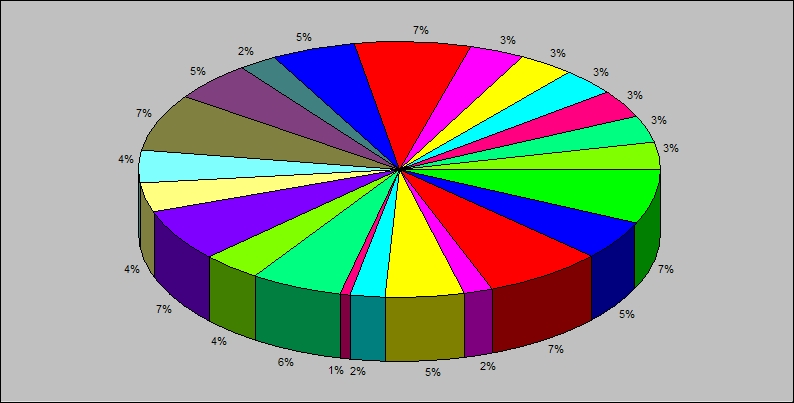
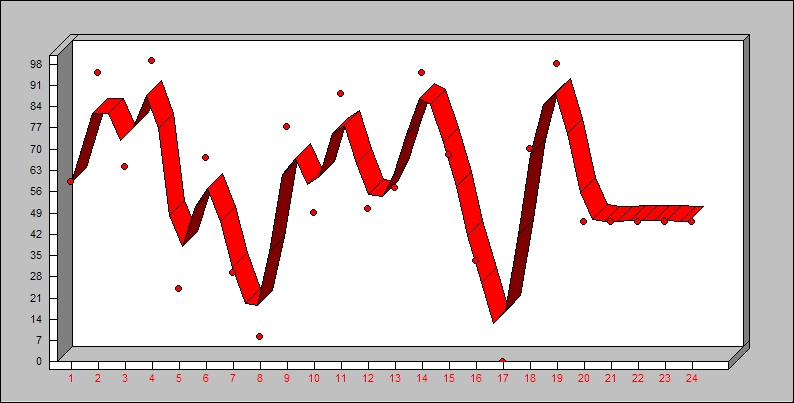
The following graphic shows the various chart views available in the SBN Graph program.
Choose Area Chart for the following display:
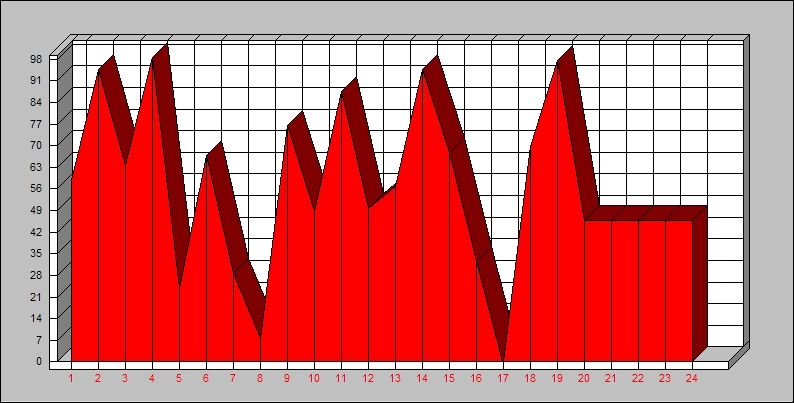
Choose Horizontal Bars for the following display:
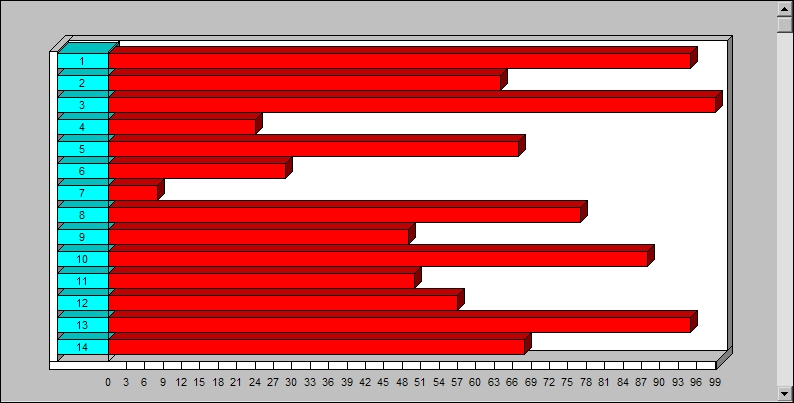
Choose Columns and Bar Chart for the following display:
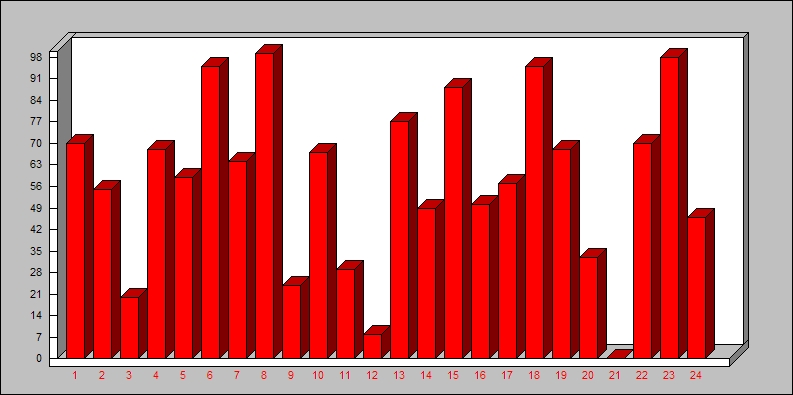
Choose Line Chart for the following display:
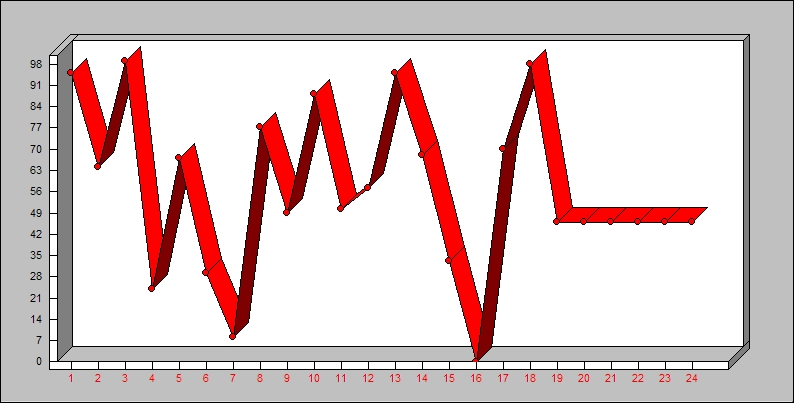
Choose Mark Point Chart for the following display:
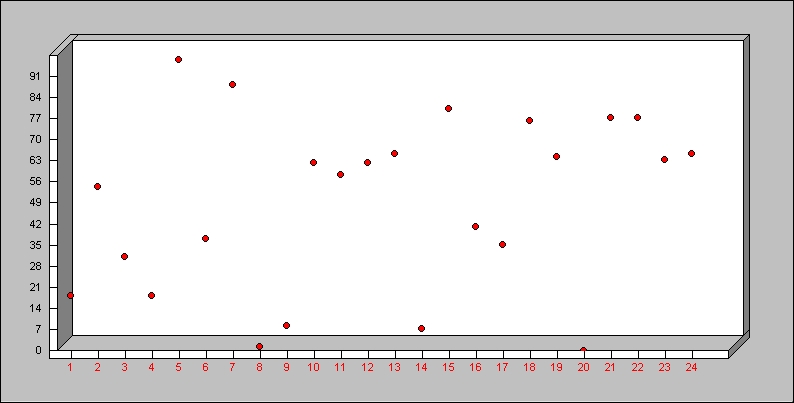
Choose Pie Chart for the following display:
Choose Fit to Curve Chart for the following display:
Modifications and Updates to SBN Graph
The following table lists modifications and updates to the SBN Graphic document.
Mod Number |
Date |
Description |