
Terminals
Program #: 1861
Module: System Administration
Overview
Use Terminals (program #1861) to define and maintain skills that you can attach to terminals for the routing of signals in Monitoring. You can define specific functionality, such as two-way voice, for specific terminals.
To access this program, select Terminals (program #1861) from the main menu of SBN.
The Terminals Window
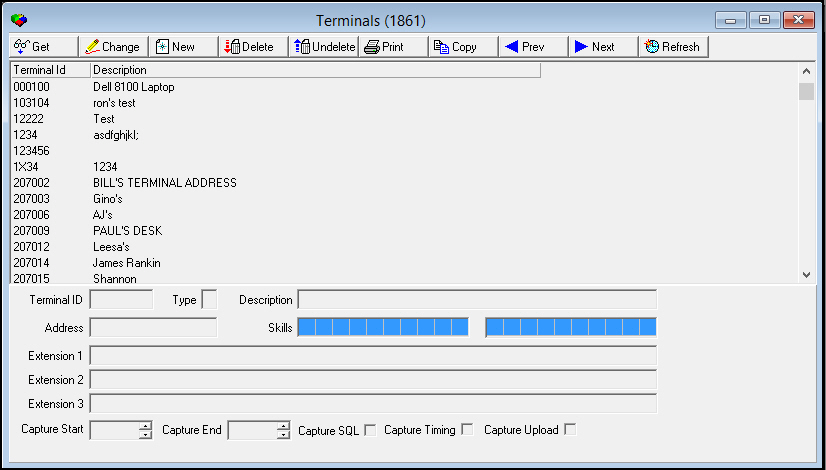
The following graphic shows Terminals as the program opens. The upper pane displays all previously defined terminals.
Field/Column Descriptions
The following table describes the fields and columns used in Terminals.
|
Field/Column |
Description |
|
Terminal ID |
Identifies the terminal to which you want to attach skills. |
|
Type |
Company-defined types, such as serial or network; no functionality in SBN. Note: Company 156 should make the IVR terminal type I. This replaces the functionality of retired option mo202. |
|
Description |
Text description of the selected terminal. |
|
Address |
IP address of the selected terminal. |
|
Skills |
Up to 20 skills to attach to the selected terminal. (This menu originates from program #1862.) |
|
Extension 1 |
Identifies the phone extension answered at the selected terminal. |
|
Extension 2 |
Identifies the phone extension answered at the selected terminal. |
|
Extension 3 |
Identifies the phone extension answered at the selected terminal. |
|
Capture Start |
Enter the time at which a debug capture is to start. |
|
Capture End |
Enter the time at which a debug capture is to end. |
|
Capture SQL |
This checkbox allows logging of SQL statements. |
|
Capture Timing |
This checkbox allows logging of the actual time of debugging events. |
|
Capture Upload |
This checkbox allows you to receive an uploaded file to the folder where the SBN executable file is saved. The file saved is titled "Debug_upload.txt". |
Using Common Functions
See the reference document Common Functions in SBN for more information.
Setting the Refresh Interval
Use the Refresh Interval to set how often, in seconds, the Terminals program refreshes. The window refreshes every 0 to 300 seconds, based on the number chosen from the Timer Value menu.
Use the following steps to set the refresh interval:
1. In Terminals, choose Refresh Interval.
‰ The Timer Value menu appears.
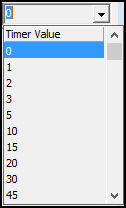
2. Choose a refresh interval from the Timer Value menu.
Setting a Debug Capture
The fields and checkboxes at the bottom of the Terminals program give you the ability to capture a CTRL+D debug procedure from a particular terminal. By selecting a time, you can determine the exact time the debug capture will start and end. If you do not select a specified time, then you will receive a debug file every hour until you choose to stop the capture by deselecting the appropriate checkboxes. If no information is selected here, then a CTRL+D debugging functions as normal.
Note: Performing debug actions from a developer's terminal using the Terminals program is not recommended. So long as the capture checkboxes are on the developer's terminal ID when CTRL+D is selected, it may be difficult, if not impossible, to stop the debugging process.
Use the following steps to set a specific debug capture start and stop:
1. Select an existing terminal and click Change, or click New to create a new terminal listing.
2. In the Capture Start field, enter the time when you wish to start the debug capture, in hours, minutes, and seconds.
3. In the Capture End field, enter the time when you wish to stop the debug capture, in hours, minutes, and seconds. If you do not enter a specified time, the capture will occur every hour until you choose to stop it.
4. Select the options by which you want to save your debug file. Select the Capture SQL, Capture Timing, and/or Capture Upload checkboxes. If you select Capture Upload, the debug file is saved as a text file, named Debug_YYMMDD_HH.txt, on the local machine hosting SBN. The files will be located in the folder from where you run the SBN executable file.
5. Enter CTRL+D to start the debugging process.
Note: You may also choose the time for a regularly hourly debug capture report. For instance, by entering 00:10:00 in the Capture Start field and 00:15:00 in the Capture End field, you will receive a debug capture report every hour at ten minutes after the hour, and ending fifteen minutes after the hour. This may be modified or stopped at any time.
Note: If a debug capture is scheduled through the Terminals program, the user of the individual terminal will not be able to use the CTRL+D option for separate debugging information. You will be able to view captured information via the Debug window, but you will not be able to turn the debug capture on or off so long as it is scheduled through the Terminals program.
Button Functions
The following table displays the buttons, describes the shortcut keys, actions, and functionality.
|
Button |
Name |
Shortcut Key |
Action |
Description |
|
|
Get |
ALT+F1 |
1861/ 1 |
Get record. |
|
|
Change |
F2 |
1861/ 2 |
Change selected record. |
|
|
New |
F3 |
1861/ 3 |
Create new record. |
|
|
Delete |
SHIFT+F10 |
1861/ 4 |
Delete selected record. |
|
|
Undelete |
ALT+F10 |
1861/ 5 |
Restore deleted record. |
|
|
|
CTRL+F8 |
1861/ 6 |
Print selected records. |
|
|
Copy |
SHIFT+F3 |
1861/ 3 |
Copy selected field. |
|
|
Previous |
F4 |
1861/ 1 |
Select last record. |
|
|
Next |
F5 |
1861/ 1 |
Select next record. |
|
|
Refresh Interval |
F6 |
1861/ 0 |
Set time value for refresh rate. |






Dealer ID and Terminal ID
A Dealer ID and dealer restriction were added to the terminal program, so users select only terminals for their own dealer. The Terminal ID field was widened.
Modifications and Updates to Terminals
The following table lists modifications and updates to the Terminals document.
|
Mod Number |
Date |
Description |
|
08.80.09585, 07.80.23264, 07.80.23263, 07.80.23262 |
4/08/14 |
Added new debug capture fields. |
|
n/a |
8/26/14 |
Images updated. |
|
|
|
|