
Service Request Cause Count Report
Service Request Cause Count Report
Service Request Cause Count Report
Report #: 1156
Module: Account Management
Overview
Use the Service Request Cause Count report to view the number of closed (outdated) service requests during a specified period by cause code. User’s branch restrictions apply.
This report sorts results alphabetically by cause code.
To access this report, choose Service Request Cause Count (report #1156) from the main menu of SBN.
The Service Request Cause Count Report Screen
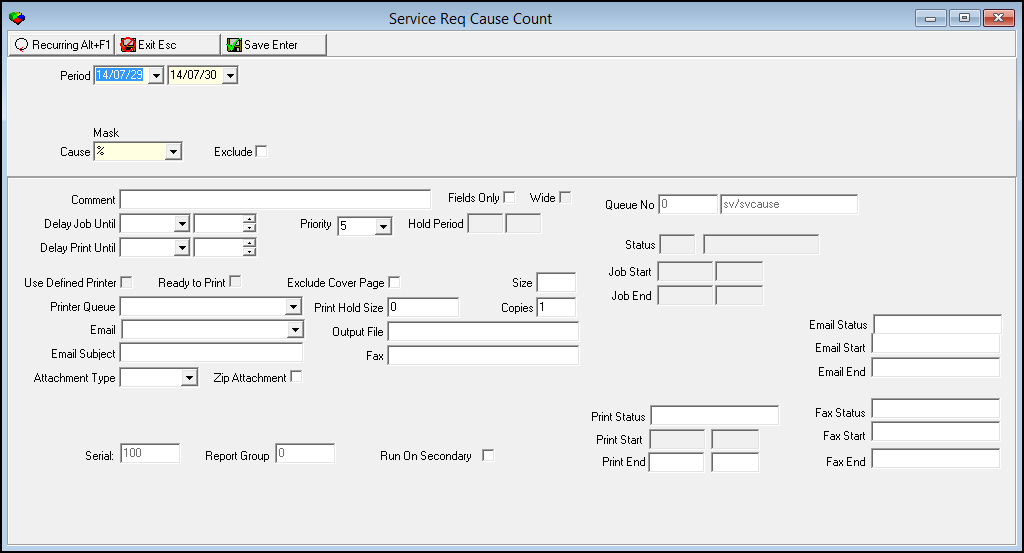
This screen contains two panels: in the upper panel you define the content of the report; in the lower panel you defining the job output - how, when, and where you want to print the report.
Note: Because all reports have the same lower panel, these fields are described in detail in the reference document Report Parameters Pane.
Field Descriptions
The following table describes the fields used in the upper section of this report.
You can use wildcard characters in selected fields. You can enter wildcard characters to expand your search. For more information about using wildcards, see Using Wildcard Characters in the reference document, Searches.
Field |
Wildcards Allowed |
Description |
Period Range |
||
Date - From (No label) |
No |
You must select a range of dates to limit the report to service requests completed within that range; select the beginning date of the range. O This field defaults to today’s date. |
Date
- To |
No |
You must select a range of dates to limit the report to service requests completed within that range; select the ending date of the range. O This field defaults to tomorrow’s date. |
Mask |
||
Cause |
Yes |
You must either select a cause code to limit the report to service requests with that cause code or use the % wildcard to include all cause codes as well as service requests without cause codes. (This menu originates from program #1571.) |
Exclude |
No |
You may exclude a cause code from the report by selecting the cause code and then entering a check mark in this field. |
Running and Viewing the Report
To run the Service Request Cause Count report
1. In Service Request Cause Count (report #1156), define the parameters for the report.
2. Choose Save to save the report to the Report Queue.
Note: For more information on using the Report Queue, see Report Queue.
3. In Report Queue (program #1558), choose Own to display the report list.
4. In the report list, locate the report.
5. Choose Own again to refresh the status of the report.
6. When the report displays an X in the Print Flag column, which indicates the report is ready, double-click it to open the report.
7. Choose Display Report.
‰ The Print Preview window opens.
Report Example
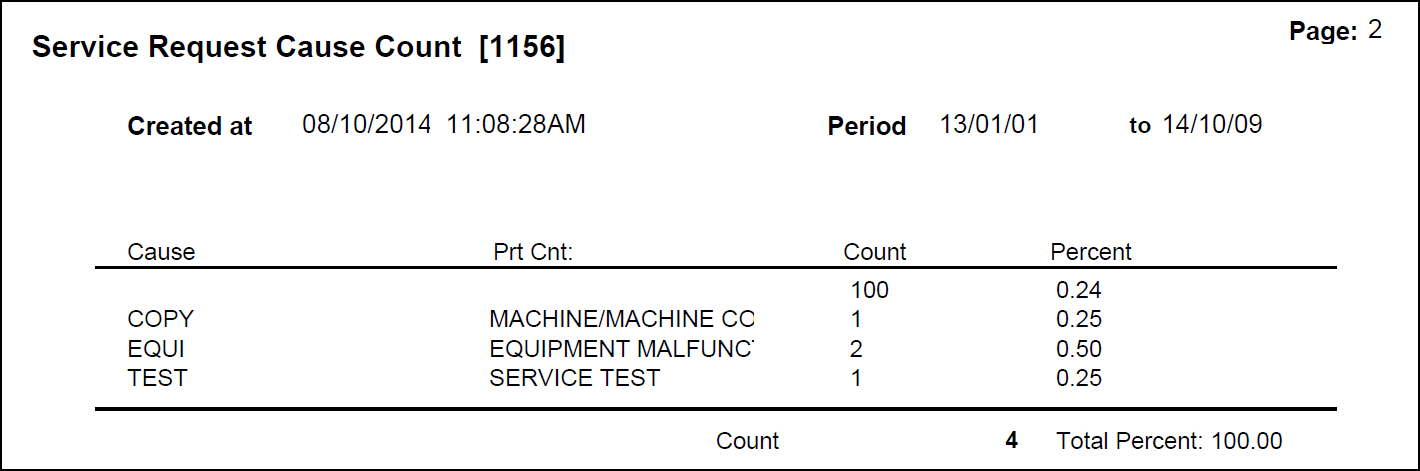
The following graphic shows an example of the output of the Service Request Cause Count report.
Column Descriptions
The following table describes the columns used in the report output.
Column |
Description |
Cause |
Code for the selected cause. |
Description |
Text description of the selected cause. |
Count |
Number of times the selected cause was attached to a service request during the specified period. |
Percent |
Displays the percentage of occurrences of the cause code during the specified period; percentage based on (Count / Total number of requests within the specified period). |
Grand Total |
Total number of cause counts and the combined percentages. |
Button Functions
The following table displays the buttons, describes the shortcut keys, actions, and functionality.
Button |
Name |
Shortcut Key |
Action |
Description |
|
Recurring |
Alt+F1 |
1156 |
Open fields for recurring/template reports. |
|
Exit |
Esc |
1156 |
Exit without saving. |
|
Save |
Enter |
1156 |
Save existing record. |



Modifications and Updates to Service Request Cause Count Report
The following table lists modifications and updates to the Service Request Cause Count Report document.
Mod Number |
Date |
Description |
n/a |
7/29/14 |
Images updated. |