
Dealer Traffic Screen
Dealer Traffic Screen
Dealer Traffic Screen
Program #: 539
Module: Utilities
Overview
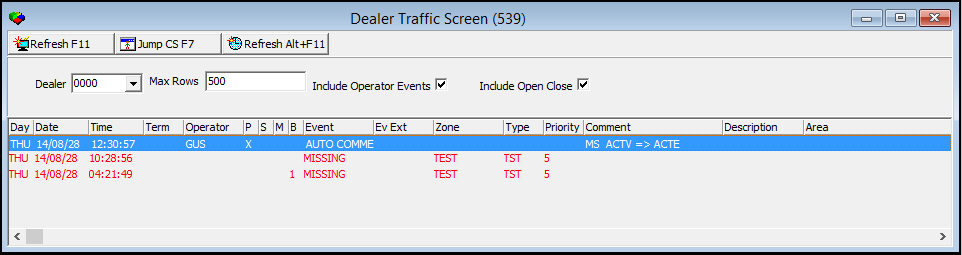
Use the Dealer Traffic Screen (program #539) to view all alarm events associated with a selected dealer. You may include events generated by operators and/or open and close alarm events. Alarm events in the Dealer Traffic Screen are read-only.
The Dealer Traffic Window
The following graphic shows the Dealer Traffic Screen with alarm event information displayed.
Field/Column Descriptions
The following table describes the fields and columns used in the Dealer Traffic Screen.
|
Field/Column |
Description |
|
Dealer |
Dealer ID associated with the installations whose alarm events are displayed in the Dealer Traffic Screen. If blank, the screen displays events from all dealers the user has access to. |
|
Max Rows |
Maximum number of rows displayed in the Dealer Traffic Screen. 500 to 10,000 rows may be displayed. |
|
Include Operator Events |
If this box contains a check mark, the Dealer Traffic Screen includes events generated by operators. |
|
Include Open Close |
If this box contains a check mark, the Dealer Traffic Screen includes open and close events. |
|
Day |
Day of the week this event occurred. |
|
Date |
Date this event entered the Alarm Log; based on the customer’s time zone. |
|
Time |
Specific time this event entered the Alarm Log; based on the customer’s time zone. |
|
Terminal ID |
Terminal number of the operator who performed the action. |
|
Operator |
Name of the operator who performed the action. |
|
Print (P) |
If this column displays an X, the event does not print when you generate a report. |
|
Supervisor Override (S) |
If this column displays an X, a supervisor marked the incident so it does not print when a consumer report is generated. |
|
Manual (M) |
If this column displays an X, the date and time for this event are manually entered, not standard. |
|
Backup CID (B) |
CID number from which the signal was received, if received from an account with multiple CIDs.
Note: When option ba219 is on, SBN uses base 0 for the CID index in the log. This means that if base 0 is being used, the first CID is index 0. When option ba219 is off, the first CID is index 1. |
|
Event |
Type of event for this incident. For example, alarm, false, or missing. Note: When you call a High Security contact from Dispatch — in association with an event — this column displays H.Sec.Co. |
|
Event Extension |
Code for the action taken for this incident. |
|
Zone |
Zone from which the incident was reported, if the incident came from a specific zone. |
|
Type |
Type of alarm that was received. |
|
Priority |
Priority (1-99) of the signal that was received. |
|
Comment |
Additional comments about the incident. |
|
Description |
Text description for the incident. Note: For Release 61 and later, the Alarm Log reads the description from the actual zone. Alarms received prior to Release 61 do not display this information. |
|
Area |
Text from the Protected Area field in Zones. Note: For Release 61 and later, the Alarm Log reads the area from the actual zone. Alarms received prior to Release 61 do not display this information. |
|
Alarm ID |
Alarm ID attached to the event. Note: If blank, the event refers to the alarm ID currently displayed in the top pane of the Service/Data Entry window. |
|
Alog Misc 1 - Alog Misc 20 |
Customer-defined subsection that displays alarm log messages customized by the monitoring company. |
|
Install # |
Installation number from which the signal was received. |
|
Customer ID |
Customer ID number from which the signal was received. |
|
Name |
Customer name at the installation from which the signal was received. |
|
Language |
ID number of the language selected for the customer. |
|
Monitoring Branch |
Monitoring location for the installation from which the signal was received. |
Viewing Dealer Traffic
You may view alarm signal traffic for installations associated with a specific dealer, or for all dealers that you have access to.
Use the following steps to look up alarm signal traffic for a specific dealer:
1. In program #539, select the dealer ID whose alarm events you want to view.
2. Enter the maximum number of rows to display on the traffic screen.
3. Check the Include Operator Events box if you want to include operator events in the display.
4. Check the Include Open Close box if you want to include open and close events in the display.
5. Choose Refresh Interval and set the interval in seconds to automatically refresh the screen, or choose SQL Refresh to display all signals for the dealer at the moment.
w The event grid populates with alarm signals generated in the last hour from installations assigned to the selected dealer.
Use the following steps to look up alarm signal traffic for all dealers you have access to:
1. In program #539, leave the Dealer field blank.
2. Enter the maximum number of rows to display on the traffic screen.
3. Check the Include Operator Events box if you want to include operator events in the display.
4. Check the Include Open Close box if you want to include open and close events in the display.
5. Choose Refresh Interval and set the interval in seconds to automatically refresh the screen, or choose SQL Refresh to display all signals for all dealers at the moment.
w The event grid populates with alarm signals generated in the last hour from installations assigned to any dealers you have access to.
Event Colors in the Dealer Traffic Screen
The Dealer Traffic Screen displays lines in different colors to indicate status, so that an operator can tell at a glance the status of each incident. The following table lists the different color possibilities.
Note: The color of specific events, such as a false alarm, can be changed by contacting your IBS Project Manager.
|
Color |
Description |
|
Red |
New alarm. |
|
Dark Green |
Operator action. |
|
Yellow |
Alarms received while in test. |
|
Olive |
Log only and trouble signals. |
|
White |
Highlighted text. |
|
Red/Dark Red |
Alarms in test. |
|
Blue |
The event abbreviation for a high priority comment appears in blue text. |
Related Programs
The following table lists programs related to the Dealer Traffic Screen.
|
Program |
Number |
Document Link |
Description |
|
Data Entry Master |
559 |
View and alter details of the customer installation from which an alarm was generated. |
|
|
Alarm Log |
N/A |
View alarm events for a specific CID in detail and add comments if desired. |
|
|
Dispatch |
N/A |
View and treat incoming alarms for a specific CID. |
Button Functions
The following table displays the buttons, describes the shortcut keys, actions and functionality.
|
Button |
Name |
Shortcut Key |
Action |
Description |
|
|
SQL Refresh |
f11 |
539/ 1 |
Show alarm events that occurred since last Refresh. |
|
|
Jump to Data Entry |
f7 |
539/ 2 |
Access Data Entry Master (program #559) with the CID details of the selected alarm event displayed. |
|
|
Refresh Interval |
alt+f11 |
539/ 3 |
Set the interval, in seconds, that alarm event information automatically refreshes. |



Modifications and Updates to the Dealer Traffic Screen
The following table lists modifications and updates to the Dealer Traffic Screen document.
|
Mod Number |
Date |
Description |
|
n/a |
08/07/08 |
document created |
|
n/a |
08/28/14 |
Images updated. |