
Response Time Statistics
Response Time Statistics
Response Time Statistics
Module: Account Management
Overview
Use the Response Time Statistics report to generate counts and averages of monitoring events.
To access this report, select Response Time Statistics (report #1981) from the main menu of SBN.
The Response Time Statistics Report
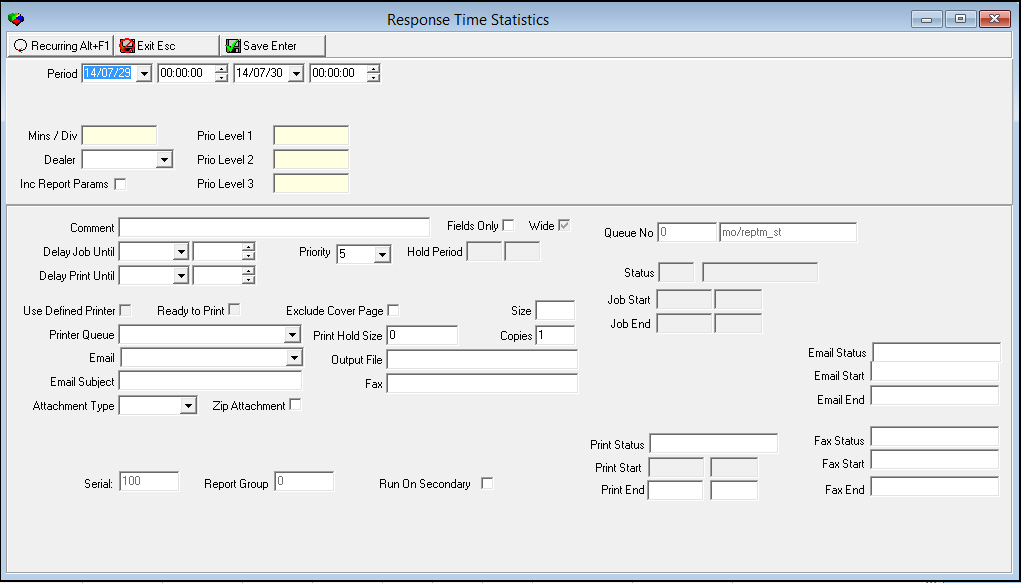
This window contains two panes: use the upper pane to define the content of the report; use the lower pane to define the job output - how, when, and where you want to print the report.
Note: See Report Parameters Pane for information on the fields in the lower pane, which are the same in every report.
Field Descriptions
The following table describes the fields used in the upper pane of the Response Time Statistics.
Field |
Description |
Period |
|
Date - From (No label) |
You may select a range of dates to limit the report to monitoring events that occurred within the range. Select the beginning date of the range. O If you leave this field blank, SBN defaults to the current day. O This report displays data based on the report user’s time, as defined in the user’s Misc. Profile. |
Time - From (No label) |
You may select a range of time to limit the report to monitoring events that occurred within the range. Select the beginning time of the range. O If you leave this field blank, SBN defaults to 00:00 (midnight). O This report displays data based on the report user’s time, as defined in the user’s Misc. Profile. |
Date
- To |
You may select a range of dates to limit the report to monitoring events that occurred within the range. Select the ending date of the range. O If you leave this field blank, SBN defaults to the current day. O This report displays data based on the report user’s time, as defined in the user’s Misc. Profile. |
Time
- To |
You may select a range of time to limit the report to monitoring events that occurred within the range. Select the ending time of the range. O If you leave this field blank, SBN defaults to 00:00 (midnight). O This report displays data based on the report user’s time, as defined in the user’s Misc. Profile. |
Mins / Div |
You must type the time division, in minutes, for the report. For example l To report statistics for each hour, type l To report statistics for an entire day, type |
Dealer |
You may select a dealer ID to limit the report to monitoring events for accounts associated with that dealer ID. (This menu originates from program #1537.) O If you leave this field blank, the report includes all dealer IDs that meet other report parameters. |
Inc Report Parameters |
Select this check box to include a cover page listing the report parameters when sending the report by email. |
Prio Level 1 |
You must type the highest priority to include in Priority Level 1. For example, to include all signals with priorities of 1 - 17, type in this field. |
Prio Level 2 |
You must type the highest priority to include in Priority Level 2. For example, to include all signals with priorities 18 - 40, type in this field. O This field starts at the next priority above the one typed in Prio Level 1. |
Prio Level 3 |
You must type the highest priority to include in Priority Level 3. For example, to include all signals with priorities 41 - 99, type in this field. O This field starts at the next priority above the one typed in Prio Level 2. |
Running and Viewing a Report
For information on running and viewing a report, see Common Functions in SBN.
Report Example
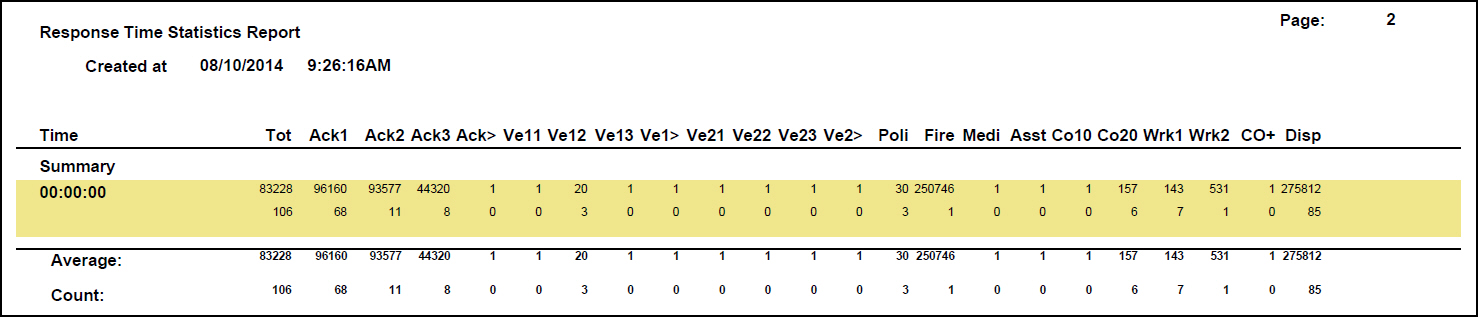
The following graphic shows an example of the output of the Response Time Statistics.
Column Descriptions
The following table describes the columns used in the output of the report.
Column |
Description |
Tot |
First Line: The average time, in seconds, that alarms received during this time division spent in the Alarm Queue. Second Line: A total count of alarms for this time division. |
Ack1 |
First Line: The average time, in seconds, that Priority Level 1 alarms received during this time division spent in the Alarm Queue. Second Line: A total count of Priority Level 1 alarms for this time division. |
Ack2 |
First Line: The average time, in seconds, that Priority Level 2 alarms received during this time division spent in the Alarm Queue. Second Line: A total count of Priority Level 2 alarms for this time division. |
Ack3 |
First Line: The average time, in seconds, that Priority Level 3 alarms received during this time division spent in the Alarm Queue. Second Line: A total count of Priority Level 3 alarms for this time division. |
Ack> |
First Line: The average time, in seconds, that alarms with a priority level greater than 3 that were received during this time division spent in the Alarm Queue. Second Line: A total count of alarms with a priority level greater than 3 for this time division. |
Ve11 |
First Line: The average time, in seconds, of Verification Call 1 of Priority Level 1 alarms received during this time division. Second Line: A total count of Priority Level 1alarms with Verification Call 1 for this time division. |
Ve12 |
First Line: The average time, in seconds, of Verification Call 1 of Priority Level 2 alarms received during this time division. Second Line: A total count of Priority Level 2 alarms with Verification Call 1 for this time division. |
Ve13 |
First Line: The average time, in seconds, of Verification Call 1 of Priority Level 3 alarms received during this time division. Second Line: A total count of Priority Level 3 alarms with Verification Call 1 for this time division. |
Ve1> |
First Line: The average time, in seconds, of Verification Call 1 of alarms with a priority level greater than 3 that were received during this time division. Second Line: A total count of alarms with a priority level greater than 3 with Verification Call 1 for this time division. |
Ve21 |
First Line: The average time, in seconds, of Verification Call 2 of Priority Level 1 alarms received during this time division. Second Line: A total count of Priority Level 1 alarms with Verification Call 2 for this time division. |
Ve22 |
First Line: The average time, in seconds, of Verification Call 2 of Priority Level 2 alarms received during this time division. Second Line: A total count of Priority Level 2 alarms with Verification Call 2 for this time division. |
Ve23 |
First Line: The average time, in seconds, of Verification Call 2 of Priority Level 3 alarms received during this time division. Second Line: A total count of Priority Level 3 alarms with Verification Call 2 for this time division. |
Ve2> |
First Line: The average time, in seconds, of Verification Call 2 of alarms with a priority level greater than 3 that were received during this time division. Second Line: A total count of alarms with a priority level greater than 3 with Verification Call 2 for this time division. |
Poli |
First Line: The average time, in seconds, to dispatch police agencies for alarms received during this time division. Second Line: A total count of alarms for which police agencies were dispatched for this time division. |
Fire |
First Line: The average time, in seconds, to dispatch fire agencies for alarms received during this time division. Second Line: A total count of alarms for which fire agencies were dispatched for this time division. |
Medi |
First Line: The average time, in seconds, to dispatch medical agencies for alarms received during this time division. Second Line: A total count of alarms for which medical agencies were dispatched for this time division. |
Asst |
First Line: The average time, in seconds, to dispatch patrol response agencies for alarms received during this time division. Second Line: A total count of alarms for which patrol response agencies were dispatched for this time division. |
Co10 |
First Line: The average time, in seconds, to call Contact 1 for alarms received during this time division. Second Line: A total count of alarms for which Contact 1 was called for this time division. |
Co20 |
First Line: The average time, in seconds, to call Contact 2 for alarms received during this time division. Second Line: A total count of alarms for which Contact 2 was called for this time division. |
Wrk 1 |
First Line: The average time, in seconds, to call Contact 3 for alarms received during this time division. Second Line: A total count of alarms for which Contact 3 was called for this time division. |
Wrk 2 |
First Line: The average time, in seconds, to call Contact 4 for alarms received during this time division. Second Line: A total count of alarms for which Contact 4 was called for this time division. |
CO+ |
First Line: The average time, in seconds, to reach a contact (Con reached) for alarms received during this time division Second Line: A total count of alarms for which a contact was reached for this time division. |
Disp |
First Line: The average time, in seconds, to assign a disposition to alarms received during this time division. Second Line: A total count of alarms for this time division. |
Average |
The average time, in seconds, per day (except when the time division is greater than one day), for alarms received in the Alarm Queue until the selected column event occurs. |
Count |
The total count, per day (except when the time division is greater than one day), of alarm signals treated with the selected column event. |
Button Functions
The following table displays the buttons, describes the shortcut keys, actions, and functionality.
Button |
Name |
Shortcut Key |
Action |
Description |
|
Recurring |
Alt+F1 |
1981 |
Open fields for recurring/template reports. |
|
Exit |
Esc |
1981 |
Exit without saving. |
|
Save |
Enter |
1981 |
Save existing record. |



Modifications and Updates to Response Time Statistics
The following table lists modifications and updates to the Response Time Statistics document.
Mod Number |
Date |
Description |
n/a |
7/29/14 |
Images updated. |