
Dashboard
Dashboard
Dashboard
Module: Utilities
Overview
Use the Dashboard (program #251) to view information on the installation or billing account you last accessed in Data Entry (program #559) or Contract Master (program #548) from several SBN programs in one screen. The Dashboard provides access to information from the Cycle Fees tab of Contract Master (program #548), the Service Log tab of Data Entry (program #559), the Open/Close Log tab of Data Entry, the Alarm Log tab of Data Entry, the Payment Status tab of Contract Master, and the Collections tab of Contract Master. Select the information you want to view in the Dashboard and jump to the installation in Data Entry or the account in Contract Master at any time.
This document covers the following topics:
Jumping to Data Entry/Customer Service
Navigating to the Dashboard
Use the following steps to access the Dashboard program:
1. From the main SBN toolbar, select Menu.
2. From the drop-down menu, select Go To.
3. In the Go To Program dialog box, type in "251" and press ENTER.
w The Dashboard window opens.
-or-
1. From the main SBN toolbar, select Misc.
2. Select Dashboard from the drop-down menu.
w The Dashboard window opens.
-or-
1. From anywhere in SBN, select [CTRL+E].
w The Dashboard window opens.
Note: You can also close the Dashboard with the keyboard shortcut [CTRL+E].
The Dashboard Window
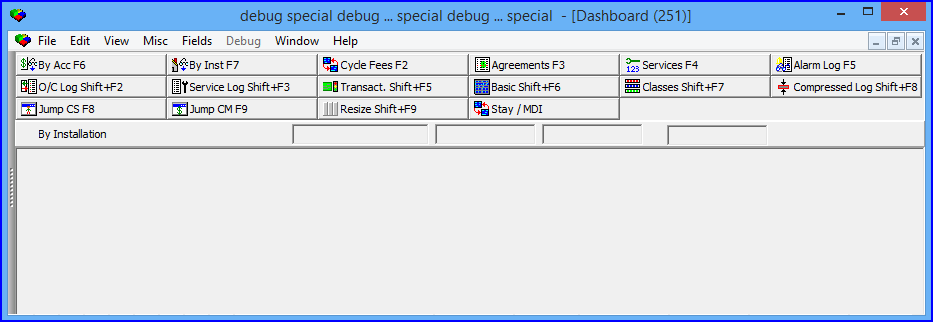
When the Dashboard program opens, the display is blank. To view information in the Dashboard window, you must choose the types of information you want to view. The columns of each tab are unique and do not appear when the Dashboard opens. The top left corner of the Dashboard window displays the mode in which you currently view the Dashboard: By Account or By Installation.
The Dashboard displays information for the installation or account you last accessed in Data Entry (program #559) or Contract Master (program #548). The mode in which the Dashboard opens is determined by the program you last accessed; if you last opened Data Entry, the Dashboard opens in By Installation mode; if you last opened Contract Master, the Dashboard opens in By Account mode. If you have not viewed an installation or account in either of these programs in your current SBN session, the Dashboard tabs are blank when you open them.
The following graphic shows the Dashboard as the program opens.
Changing the Dashboard View
Choose By Account to view data from the billing account you last accessed in Contract Master, or from the billing account associated with the installation you last accessed in Data Entry. Choose By Installation to view data from the installation you last accessed in Data Entry, or from the installation associated with the billing account you last accessed.
The Dashboard has 11 buttons you can choose to view information from various areas of SBN.
Cycle Fees
Agreements
Services
Alarm Log
O/C Log
Service Log
Transactions
Basic
Classes
Compressed Log
You may select all 11 of these buttons to view all 10 tabs, or just a few according to your preferences.
Only the Basic tab includes a scroll bar so that you may scroll up or down to view information that does not fit in the tab. By design, the Dashboard is intended to provide only a small amount of information at a glance. If you want to view more information than fits in any of the other tabs, go to the area of SBN from which that tab's information originates.
The Cycle Fees Tabs
Choose Cycle Fees to view the Cycle Fees Tree View tab and Cycle Fees List tab. These tabs display information from the Cycle Fees tab of Contract Master (program #548) for the installation or billing account you last accessed. Cycle fees are charged to customers through invoices at regular intervals, (monthly, bi-monthly, etc). Choose Cycle Fees again to remove the Cycle Fees tabs from the Dashboard display.
Note: When you add tabs to the display, they appear below other tabs you have already added. If you remove tabs from the display and add them again later, they will appear below the existing tabs.
The Cycle Fees Tree View tab displays cycle fees for the selected installation or account along with a tree view that displays the contracts and installations associated with an account. The Cycle Fees List tab lists cycle fees for the selected installation or account without the tree view.
The following graphic shows the Cycle Fees Tree View tab. The columns are the same in the Cycle Fees List tab.

Column Descriptions
The following table describes the columns in the Cycle Fees tabs.
Column |
Description |
Fee |
Cycle fee amount. At the bottom of this column is the total of all cycle fees in the tab. |
Revenue Type |
Code for the type of fee being charged to the customer. (Define Revenue Types in program #1512.) |
Description |
Description of the item the cycle fee applies to. (Define items in program #1535.) |
Account # |
Billing account number the cycle fee applies to. |
Dealer ID |
Billing account dealer. |
Contract # |
Contract number the cycle fee applies to. |
Dealer ID |
Contract dealer. |
Install # |
Installation number the cycle fee applies to. |
Dealer ID |
Installation dealer. |
Alias Name |
Alias name or A.K.A. for the installation. |
Address |
Address of the installation. |
Group1 |
Financial group assigned to the installation. |
ItemCd |
Item code for the product or service. |
PO # |
P.O. # associated with the installation. |
Name |
Name associated with the installation. |
From |
Dates when the service agreements become valid. |
Valid To |
Dates when the service agreements are no longer valid. |
Cycle Date |
Latest invoice date for all cycle fees for the selected contract. |
Cycle Period |
Frequency, in months, for invoicing this cycle fee. |
Active |
Column is populated if a cycle fee is attached to an active installation. |
WO # |
Work Order number associated with the installation. |
The Agreements Tabs
Choose Agreements to view the Agreements Tree View tab and Agreements List tab. These tabs display service agreements from the Agreements grid of Data Entry Master (program #559) and the Agreements grids in the Billing Accounts and Contract/Installation tabs of Contract Master (program #548) for the installation or billing account you last accessed. (The menus of the Agreements fields in Data Entry and Contract Master originate from program #1643.) Choose Agreements again to remove the Agreements tabs from the Dashboard display.
Note: When you add tabs to the display, they appear below other tabs you have already added. If you remove tabs from the display and add them again later, they will appear below the existing tabs.
The Agreements Tree View tab displays service agreements for the selected installation or account along with a tree view that displays the contracts and installations associated with an account. The Agreements List tab lists service agreements for the selected installation or account without the tree view.
The following graphic shows the Agreements List tab. The Agreements Tree View tab includes only the Agreement, Description, and Type columns.

Column Descriptions
The following table describes the columns in the Agreements tabs.
Column |
Description |
Agreement |
ID code for the service agreement. |
Description |
Text description of the service agreement. |
Type |
Service agreement type. |
Account # |
Billing account number the service agreement applies to. |
Dealer ID |
Billing account dealer. |
Contract # |
Contract number the service agreement applies to. |
Dealer ID |
Contract dealer. |
Install # |
Installation number the service agreement applies to. |
Dealer ID |
Installation dealer. |
The Services Tabs
Choose Services to view the Services Tree View tab and Services List tab. The Services tabs are not yet functional in SBN. Choose Services again to remove the Services tabs from the Dashboard display.
Note: When you add tabs to the display, they appear below other tabs you have already added. If you remove tabs from the display and add them again later, they will appear below the existing tabs.
The Alarm Log Tab
Choose Alarm Log to view the Alarm Log tab. This tab displays information from the Alarm Log tab of Data Entry (program #559) for the installation or billing account you last accessed. The Alarm Log displays recorded alarm incidents for installations. Choose Alarm Log again to remove the Alarm Log tab from the Dashboard display.
Note: When you add tabs to the display, they appear below other tabs you have already added. If you remove tabs from the display and add them again later, they will appear below the existing tabs.
The following graphic shows the Alarm Log tab.

Column Descriptions
The following table describes the columns in the Alarm Log tab.
Column |
Description |
Day |
Day of the week that the alarm event occurred. |
Date |
Date the event entered the Alarm Log. This field is based on either the customer's or operator's time zone. Note: Use Toggle Operator/Premises Time in Data Entry Master (program #559) to switch between time zones. |
Time |
Time the event entered the Alarm Log. This field is based on either the customer's or operator's time zone. Note: Use Toggle Operator/Premises Time in Data Entry Master (program #559) to switch between time zones. |
Terminal ID |
Terminal number of the operator who performed the action. |
Operator |
Name of the operator who performed the action. |
If this column displays an X, the event does not print when you generate a report. |
|
Supervisor Override |
If this column displays an X, a supervisor marked the incident so it does not print when you generate a report. |
Manual |
If this column displays an X, the date and time for this event were manually entered. |
Backup CID |
CID number from which the signal was received. This field only displays a CID if the signal was received from an installation with multiple CIDs.
Note: When option ba219 is on, SBN uses a base number of zero (0) for the CID index in the log; thus when a signal is received from the primary CID, this column is blank. If a signal is received from the second CID, this column displays a 1. If a signal is received from the third CID, this column displays a 2, and so on. When option ba219 is off, the first CID is index 1. |
Event |
Type of event for this incident. For example, alarm, false, or missing. Note: When you call a High Security contact from Dispatch in association with an event this column displays H.Sec.Co. |
Event Extension |
Code for the action taken for this incident. |
Zone |
Zone from which the incident was received, if applicable. |
Type |
Type of alarm that was received. |
Priority |
Priority (1-99) of the signal that was received. |
Comment |
Additional comments about the incident. Note: Use messages 9865 and 9866 in GUI Messages (program #1606), group MISC, to enter alternate text for this field depending on the passcard type that is validated for the monitoring event. Message 9865 identifies an installer, and 9866 identifies a technician. |
Description |
Text description for the incident. Note: For Release 61 and later, the Alarm Log reads the description from the Text field of the zone from which the alarm originated. Alarms received prior to Release 61 do not display this information. This data originates from the Zones tab for certain monitoring events including events 123 through 131. |
Area |
This field populates from the Protected Area field in the Zones tab. Note: For Release 61 and later, the Alarm Log reads the area from the zone from which the alarm originated. Alarms received prior to Release 61 do not display this information. This data originates from the Zones tab for certain monitoring events including events 123 through 131. |
Alarm ID |
Alarm ID attached to the event. Note: If blank, the event refers to the alarm ID currently displayed in the top pane of the Data Entry Master window. |
Alog M1 - Alog M20 |
Customer-defined subsection that displays alarm log messages customized by the Monitoring company. |
The O/C Log Tab
Choose O/C Log to view the Open/Close Log tab. This tab displays information from the Open/Close Log tab of Data Entry (program #559) for the installation or billing account you last accessed. The Open/Close Log displays recorded Open/Close incidents for installations. Choose O/C Log again to remove the O/C Log tab from the Dashboard display.
Note: When you add tabs to the display, they appear below other tabs you have already added. If you remove tabs from the display and add them again later, they will appear below the existing tabs.
The following graphic shows the O/C Log tab.

Column Descriptions
The following table describes the columns in the O/C Log tab.
Column |
Description |
Day |
Day of the week that the event occurred. |
Date |
Date the event entered the Open/Close Log. This field is based on either the customer's or operator's time zone. Note: Use Toggle Operator/Premises Time in Data Entry Master (program #559) to switch between time zones. |
Time |
Time the event entered the Open/Close Log. This field is based on either the customer's or operator's time zone. Note: Use Toggle Operator/Premises Time in Data Entry Master (program #559) to switch between time zones. |
Zone |
Zone from which the event was received. |
Schedule # |
Schedule number attached to the zone from which the event was received. (This column originates from the O/C Schedule tab.) |
Type |
Type of event recorded: Open, Close or Change. |
Expect |
Shows the event SBN expected: Missing or Log-Only. |
Alarm |
If this column displays an X, SBN generated an alarm from the signal received. |
User |
User ID of the person that sent the Open/Close. |
If this column displays an X, the incident does not print when you generate a report. |
|
Supervisor Override |
If this column displays an X, a supervisor marked the incident so it does not print when you generate a report. |
Manual |
If this column displays an X, the date and time for this event were manually entered; SBN did not enter the date and time. |
Backup CID |
CID number from which the signal was received. This field only displays a CID if the signal was received from an installation with multiple CIDs.
Note: When option ba219 is on, SBN uses a base number of zero (0) for the CID index in the log; thus the first CID index is 0. When option ba219 is off, the first CID is index 1. |
Name |
Name of active user or an additional comment. |
Schedule Date |
Date the event was scheduled to occur. |
Schedule Time |
Time the event was scheduled to occur. |
Manual/Automatic |
Indicates whether schedule Date/Time refers to an automatic schedule entry or a manually modified entry. |
The Service Log Tab
Choose Service Log to view the Service Log tab. This tab displays information from the Service Log tab of Data Entry (program #559) for the installation or billing account you last accessed. The Service Log displays details of service requests for installations. Choose Service Log again to remove the Service Log tab from the Dashboard display.
Note: When you add tabs to the display, they appear below other tabs you have already added. If you remove tabs from the display and add them again later, they will appear below the existing tabs.
The following graphic shows the Service Log tab.

Column Descriptions
The following table describes the columns in the Service Log tab.
Column |
Description |
Request Number |
SBN-generated number to identify the service request. |
In-Date |
Date and time this request was created. |
Out-Date |
If the request has been closed, the date and time it was closed displays in this column. Note: Option sv012 controls this field. |
Status Code |
Code to define the status of this request. |
Schedule Date |
Date service on this request is scheduled. Note: Option sv012 controls this field. |
Technician ID |
ID of the service technician assigned to this service request. |
Print Date |
Date this request was last printed. |
Print Count |
Number of times this request has been printed. |
User ID |
ID of the user that last entered information on this service request. Note: Option sv012 controls this field. |
Call Type |
Reason the customer called about the installation. |
Problem Code |
Code to define the problem reported in this service request. |
Problem Item |
Code to identify the item that is malfunctioning. |
Problem Zone |
Zone that is having problems. |
Cause |
Cause of the problem as determined by the service technician. |
Resolution Code |
Code to define the resolution for this service request. |
Resolution Item |
Item identified by the service technician as the malfunctioning item. |
Resolution Zone |
Zone identified by the service technician as the malfunctioning zone. |
Work Order Number |
Work order number of the work order that covers the charges incurred by this service request. Note: When option sv053 is on, it controls the creation of work orders. |
Invoice Reference |
User defined reference number for this invoice. |
Closed |
If this column displays an X, the corresponding work order has been closed. |
Terminal ID |
The Terminal ID of the monitoring operator. |
Count |
Displays the resolution count for the selected service request number. |
Resolution Item 2 |
Item identified by the service technician as the malfunctioning item. |
Problem Item 2 |
Code to identify the item that is malfunctioning. |
Invoice Flag |
Indicates if the work order for the service request has been invoiced. |
Problem Item Serial No |
50 character alpha-numeric field that holds the serial number of the item needing service. |
Resolution Item Serial No |
50 character alpha-numeric field that holds the serial number of the item used to fix/replace service item. |
The Transactions Tab
Choose Transactions to view the Transactions tab. This tab displays information from the Payment Status tab of Contract Master (program #548) for the installation or billing account you last accessed. The Payment Status tab displays details of payment transactions on billing accounts. Choose Transactions again to remove the Transactions tab from the Dashboard display.
Note: When you add tabs to the display, they appear below other tabs you have already added. If you remove tabs from the display and add them again later, they will appear below the existing tabs.
The following graphic shows the Transactions tab.

Column Descriptions
The following table describes the columns in the Transactions tab.
Column |
Description |
System Date |
Date the transaction was posted. The most recent transaction is first in the list. |
Transaction Date |
Date the transaction was entered. |
Transaction Code |
Keyword for the type of transaction. |
Batch Number |
Payment or invoice batch number from which this transaction was generated. |
Invoice Number |
Invoice number from which this transaction was generated. |
Invoice Amount |
Original invoice amount for this transaction. |
Check Number |
Check number of a posted payment. |
Paid Amount |
Amount paid on this transaction. |
Balance |
Running account balance. |
Due Date |
Due date of the invoice. |
Contract # |
Contract number attached to the invoice. |
External Invoice No |
Customer-defined external invoice number. |
Fiscal Date |
The fiscal date of the selected payment. |
Account # |
Account number where the payment was applied. |
Balance |
Remaining unapplied balance for the selected payment. |
Unallocated |
Indicates whether the entire or partial amount of the payment remains unapplied. |
External Batch No |
Displays the external batch number for a payment. |
Currency |
Primary currency type of the account. |
Line Item Currency |
Currency type of the transaction in this line item. |
Line Item Currency Amount |
Amount of the transaction in the selected currency of the line item. |
Original Currency Amount |
Amount of the transaction in the primary currency of the account. |
The Basic Tab
Choose Basic to view the Basic tab. This tab displays information from Data Entry (program #559) and the Collections tab of Contract Master (program #548) for the installation or billing account you last accessed. Data Entry displays information users need to answer customers' most frequently asked questions about monitoring, maintenance, and billing. The Collections tab displays information users need to collect on past due balances of billing accounts. Choose Basic again to remove the Basic tab from the Dashboard display.
Note: When you add tabs to the display, they appear below other tabs you have already added. If you remove tabs from the display and add them again later, they will appear below the existing tabs.
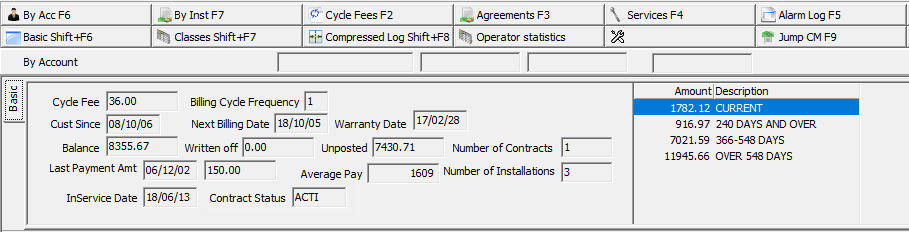
The following graphic shows the Basic tab.
Field Descriptions
The following table describes the fields in the Basic tab.
Field |
Description |
Cycle Fee |
Cycle fee amount for this installation. Note: The invoicing of the original installation work order and any subsequent add-on work orders creates this data. |
Billing Cycle Frequency |
Frequency of cycle billing that a user defined for this contract in Contract Master. |
Customer Since |
Original online date for the installation. |
Next Billing Date |
Date on which the next cycle billing will occur. |
Warranty Date |
Warranty expiration date. |
Balance |
Current open balance for the installation billing account. |
Written Off |
Total of all amounts previously written off of this account. This field comes from the Collections tab of Contract Master (program #548). |
Unposted |
Total of any unposted payments for this account. This field comes from the Collections tab of Contract Master (program #548). |
Number of Contracts |
Number of contracts on the billing account. |
Last Payment Amount |
Amount of the last payment posted to the billing account for this installation. This field comes from the Collections tab of Contract Master (program #548). |
Last Payment Amount Date (No label) |
Date of the last payment posted to the billing account for this installation. This field comes from the Collections tab of Contract Master (program #548). |
Average Pay |
Calculated average payment days for this contract or installation. SBN calculates the average payment days based on the difference between the invoice system date and the payment system date for all fully paid invoices. If no payment has been received, a row of asterisks displays. This field comes from the Collections tab of Contract Master (program #548). |
Number of Installations |
Number of installations on the billing account. |
InService Date |
Date the contract was first recorded as online. (Originates from Contract Master #548). |
Contract Status |
Current contract status for this contract. (Originates from Contract Master #548). |
Aging Table |
|
Amount |
Amount owed at a certain point in time. (This originates from Contract Master (#548)). |
Description |
Description of what is owed based off amount of time passed. (This originates from Aging Levels (#1802)). |
The Classes Tab
Choose Classes to view the Classes tab. This tab displays information from the Class field and the Class Descriptions dialog box of Data Entry (program #559) for the installation or billing account you last accessed. The Class field of Data Entry is used to track services customers request or other customer-specific information. Choose Classes again to remove the Classes tab from the Dashboard display. The menus of the fields in the Classes tab originate from program #1555.
Note: When you add tabs to the display, they appear below other tabs you have already added. If you remove tabs from the display and add them again later, they will appear below the existing tabs.
The following graphic shows the Classes tab.

Column Descriptions
The following table describes the columns in the Classes tab.
Column |
Description |
Number |
Index number of the class field from program #559. |
Class |
Customer-specific class code. |
Description |
Description of each class code for services requested, account information, or other customer-specific information. |
The Compressed Log Tab
Choose Compressed Log to view the Compressed Log tab. This tab displays information from the Alarm Log tab of Data Entry (program #559) in Compressed mode for the installation or billing account you last accessed. The Alarm Log Compressed mode displays each alarm incident in one line for easy viewing. Choose Compressed Log again to remove the Compressed Log tab from the Dashboard display.
Note: When you add tabs to the display, they appear below other tabs you have already added. If you remove tabs from the display and add them again later, they will appear below the existing tabs.
The following graphic shows the Compressed Log tab.

Column Descriptions
The following table describes the columns in the Compressed Log tab.
Column |
Description |
Day |
Day of the week that the alarm event occurred. |
Date |
Date the event entered the Alarm Log. This field is based on either the customer's or operator's time zone. Note: Use Toggle Operator/Premises Time in Data Entry Master (program #559) to switch between time zones. |
Time |
Time the event entered the Alarm Log. This field is based on either the customer's or operator's time zone. Note: Use Toggle Operator/Premises Time in Data Entry Master (program #559) to switch between time zones. |
Incident # |
SBN-assigned ID number of the alarm incident. |
Priority |
Priority (1-99) of the signal that was received. |
Zone ID |
Zone from which the incident was received. |
Type |
Type of alarm that was received. |
Ack |
If this column displays an X, the alarm incident has been acknowledged by an operator. |
Police |
If this column displays an X, an operator contacted a police agency. |
Fire |
If this column displays an X, an operator contacted a fire agency. |
Medical |
If this column displays an X, an operator contacted a medical agency. |
Patrol |
If this column displays an X, an operator contacted a patrol agency. |
Verify 1 |
If this column displays an X, an operator placed a verification call to the primary phone number of the premises action plan contact. |
Verify 2 |
If this column displays an X, an operator placed a verification call to the secondary phone number of the premises action plan contact. |
Contact 1 |
If this column displays an X, an operator placed a call to action plan contact 1. |
Contact 2 |
If this column displays an X, an operator placed a call to action plan contact 2. |
Contact 3 |
If this column displays an X, an operator placed a call to action plan contact 3. |
Contact 4 |
If this column displays an X, an operator placed a call to action plan contact 4. |
Reach Contact |
If this column displays an X, an operator used the Contact Reach monitoring action to indicate they reached an action plan contact. |
Disposition |
If this column displays an X, the alarm has been resolved and disposed of. |
Disposition |
Event entered when an operator resolved and disposed of the alarm. |
Event Extension |
Event extension entered when an operator resolved and disposed of the alarm. |
UL Ticket |
UL ticket associated with the alarm event. |
A6 |
If this column displays an X, an operator placed a call to the action plan Agency 6 contact. |
A7 |
If this column displays an X, an operator placed a call to the action plan Agency 7 contact. |
A8 |
If this column displays an X, an operator placed a call to the action plan Agency 8 contact. |
A9 |
If this column displays an X, an operator placed a call to the action plan Agency 9 contact. |
The Standard Labor Tab
Choose Standard Labor to view the Standard Labor Rates. The grouping of services are defined within Service Miscellaneous (#1709) and the rates displayed are as defined within Standard Labor Rates (#1795) when Zoomed into a specific Branch.
Note: To view and set specific labor rates, please go to Standard Labor Rates (#1795).
The following graphic shows the Standard Labor tab..

Column Descriptions
The following table describes the columns in the Standard Labor tab.
Column |
Description |
Group |
This field is user defined and originates from Service Miscellaneous (#1709). |
Item Code |
Item identifier. This field originates from Items (#1535). |
Rate |
Displays the Rate which is defined by the user in Standard Labor Rates (#1795). |
Min Interval |
Displays Minimal Interval of time in which a customer will be charged. This field is defined in the lower pane. |
Add Rate |
Displays Additional interval rate which may be charged for any additional time past the set minimal interval. |
Add Interval |
Displays Additional Interval of time spent at a site past the minimal interval. Any time past the minimal time will be charged with the additional interval rate fee per specified additional interval. Example: If a Service is defined as being charged at $X.XX for a set amount of time (Minimal Interval) and any additional time within increments of "X" amount of minutes (Additional Intervals) is needed then an additional (interval) rate may be charged as defined within Standard Labor Rates (#1795) by the user. |
Trip Charge |
Displays the charge issued per visit to an on-site location. This is user defined. |
Trip Item |
Display the Item code used to define the cost of the trip. |
Flat Fee |
Displays the one-time fee with no additional costs as specified by the user. |
Flat Item |
Displays the Item code used to define the cost of the Flat Fee. |
Portal |
Displays the hours that were calculated based on the en route & off-site times (misc log) if applicable. |
Jumping to Data Entry/Customer Service
Choose Jump To Data Entry to open Data Entry/Customer Service (program #559) with the selected installation displayed. If you are viewing the Dashboard in By Account mode when you choose Jump To Data Entry, Data Entry displays the installation associated with the billing account you are viewing in the Dashboard.
Jumping to Contract Master
Choose Jump To Contract Master to open Contract Master (program #548) with the selected billing account displayed. If you are viewing the Dashboard in By Installation mode when you choose Jump To Contract Master, Contract Master displays the billing account associated with the installation you are viewing in the Dashboard.
Resizing the Dashboard Window
You can quickly adjust the size of the Dashboard window by choosing the Resize button. SBN adjusts the Dashboard window to fill a percentage of the SBN screen (defined by option ba461) on the left side. If you open Data Entry (program #559), Contract Master (program #548), or Marketing (program #562), SBN adjusts the size of that program window to fill the remaining percentage of the SBN screen on the right side.
Note: The value of option ba461 must be between 25 and 75. If outside this range, SBN defaults to 25.
Related Programs
The following table lists programs related to the Dashboard.
Program |
Number |
Document Link |
Description |
Data Entry/Customer Service |
559 |
Enter customer contact and monitoring information about alarm system installations. |
|
Contract Master |
548 |
Enter and manage contract information for billing and payment information for each installation, contract, or account. |
|
Cycle Fees Tab |
n/a |
Add and change fees that are charged to the customer on invoices at regular intervals. Data from this tab appears in the Dashboard Cycle Fees tabs. |
|
Agreements |
Define service agreements to attach to installations in program #559 and billing accounts and contracts in program #548. Service agreements on installations, contracts, and accounts appear in the Dashboard Agreements tab. |
||
Alarm Log Tab |
n/a |
Displays recorded alarm incidents for installations. Data from this tab appears in the Dashboard Alarm Log tab. |
|
O/C Log Tab |
n/a |
Displays recorded Open/Close incidents for installations. Data from this tab appears in the Dashboard O/C Log tab. |
|
Service Log Tab |
n/a |
Displays details of service requests for installations. Data from this tab appears in the Dashboard Service Log tab. |
|
Payment Status Tab |
n/a |
Displays details of payment transactions on billing accounts. Data from this tab appears in the Dashboard Transactions tab. |
|
Collections |
Displays information users need to collect on past due balances of billing accounts. Data from this tab appears in the Dashboard Basic tab. |
Button Functions
The following table displays the buttons, describes the shortcut keys, actions and functionality.
Button |
Name |
Shortcut Key |
Action |
Description |
|
By Account |
f6 |
View data from the billing account you last accessed in Contract Master (program #548), or from the billing account associated with the installation you last accessed in Data Entry (program #559). |
|
|
By Installation |
f7 |
View data from the installation you last accessed in Data Entry (program #559), or from the installation associated with the billing account you last accessed in Contract Master (program #548). |
|
|
Cycle Fees |
f2 |
251/ 1 |
View the Cycle Fees Tree View tab and Cycle Fees List tab. |
|
Agreements |
f3 |
251/11 |
View the Agreements Tree View tab and Agreements List tab. |
|
Services |
f4 |
251/21 |
View the Services Tree View tab and Services List tab. |
|
Alarm Log |
f5 |
251/31 |
View the Alarm Log tab. |
|
O/C Log |
shift+f2 |
251/41 |
View the O/C Log tab. |
|
Service Log |
shift+f3 |
251/51 |
View the Service Log tab. |
|
Transactions |
shift+f5 |
251/61 |
View the Transactions tab. |
|
Basic |
shift+f6 |
251/71 |
View the Basic tab. |
|
Classes |
shift+f7 |
251/81 |
View the Classes tab. |
|
Compressed Log |
shift+f8 |
251/91 |
View the Compressed Log tab. |
|
Operator Statistics |
251/101 |
View the Operator Statistics tab. |
|
|
Jump to Data Entry |
f8 |
251/121 |
Open Data Entry (program #559) with the selected installation displayed. |
|
Jump to Contract Master |
f9 |
251/122 |
Open Contract Master (program #548) with the selected billing account displayed. |
|
Resize |
shift+f9 |
Change the size of the Dashboard window to fill a percentage of the SBN screen defined by option ba461. |
















Modifications and Updates to the Dashboard
The following table lists modifications and updates to the Dashboard document.
Mod Number |
Date |
Description |
n/a |
09/14/10 |
Document created. |
07.02.20015, 08.03.07751 |
09/17/10 |
Added Resize button and option ba461. |
07.02.19960, 08.03.07708 |
09/30/10 |
Added cycle fee total to Cycle Fees tabs. Added Number of Contracts and Number of Installations fields to Basic tab. |
08.03.08003 |
01/19/11 |
Added a scroll bar to the Basic tab. |
n/a |
09/15/12 |
Changed Dashboard shortcut key to CTRL+E. |
08.79.09428, 07.79.22995, 08.79.09422, 07.79.22982 |
10/04/13 |
Added Alias Name, Address, Group1, and ItemCd columns to the Cycle Fees tabs. |
n/a |
08/28/14 |
Images updated. |
08.79.09236, 07.79.22641, 07.79.22640 |
01/30/14 |
Added section on the Operator Statistics tab. |
08.89.11428 |
07/06/18 |
Added Aging table within Basic pod. Amounts shown originate from Contract Master program #548. The time frame's of the aging limits are defined in Aging Level (#1802). |
08.89.11468, 07.89.25952, 07.89.25960 |
08/09/18 |
New pod within Dashboard for Standard Labor Rate. Images updated. |
07.89.25964, 08.89.11483 |
08/09/18 |
Address field within Cycle Fee's tab has been split from having name and address to address only. New Name column added separate. PO# column also added. Images updated. |
07.89.25974, 08.89.11491 |
08/23/18 |
Valid From, Valid To, Cycle Date, Cycle Period, and Active fields added within the Cycle Fees Tab. |
07.90.26141, 08.90.11649 |
02/22/19 |
Dashboard (#251) now has a Work Order number column in the Cycle Fee tab.. |
07.91.26195, 08.91.11708 |
06/20/19 |
Dashboard (#251) now has Contract Status and InService Date added in the Basics tab. Images updated. |
F1 Help
| Delphi Forms | blrevenuetypesform |
| Program Numbers | 1512 |